
10 tips for understanding the real trial results in biotech investing
Part 1: Endpoints, significance, and how to spot the real data not the story the company is selling.

tl;dr
Don’t trust the headline. Think what would matter to the actual patient. Check, check and check again the statistics being used to sell you the story.
The problem for investors
Drug trial press releases are documents written by sponsors, lawyers, and investor relations teams. They are not neutral summaries of what was found. The techniques used to present disappointing results are well-catalogued. This piece walks through ten of them across endpoints and statistics and crucially gives you the method for checking if they are being used in the data you’re seeing.
Endpoint tricks
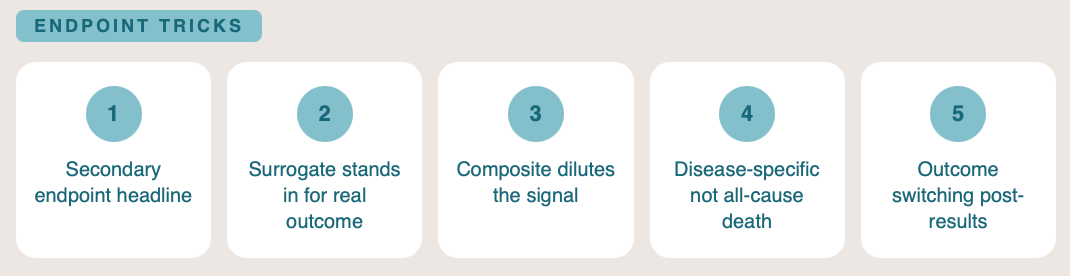
1. Primary endpoint failure, secondary endpoint headline.
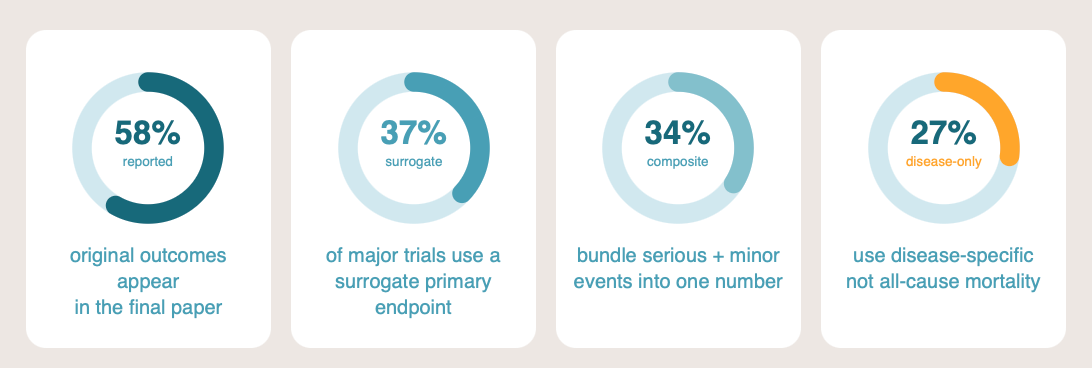
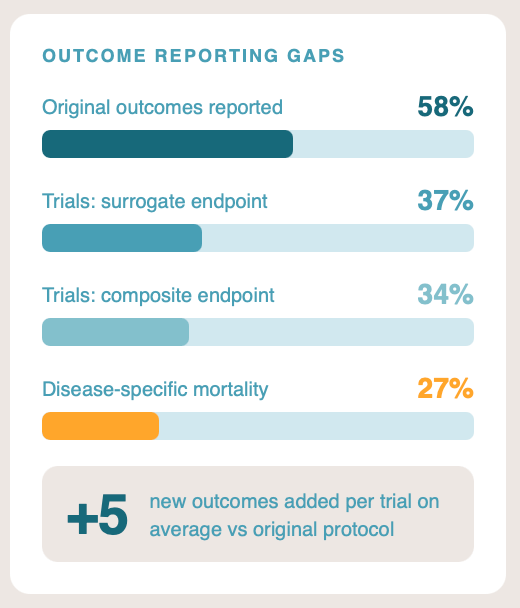
The primary endpoint is what the trial was powered and registered to test. If it fails, the trial failed. Press releases routinely lead with a secondary endpoint that happened to hit significance, sometimes burying the primary miss in paragraph four. In a systematic comparison of registered protocols against published reports, only around 58% of original outcomes were reported in the paper, and approximately five new outcomes had been added on average.1
How to check: Cross-reference the published paper or press release against the original entry on ClinicalTrials.gov (or the EU Clinical Trials Register for European studies). The registration shows the pre-specified primary endpoint and a timestamped trail of any amendments. If the headline result is a secondary endpoint and the primary outcome is mentioned only in passing, treat the trial as a miss.
Case study
The clearest recent biotech example is Biogen’s aducanumab (Aduhelm) for Alzheimer’s disease. Both Phase 3 trials, EMERGE and ENGAGE, were stopped early in March 2019 for futility. Seven months later, Biogen announced that a post-hoc reanalysis with additional follow-up data showed EMERGE had met its primary endpoint at the higher dose. ENGAGE still missed. The FDA’s own statistical reviewers and its independent advisory committee opposed approval. The agency approved the drug anyway in June 2021 on the basis of amyloid plaque reduction, a surrogate. Three advisory committee members resigned. Biogen withdrew the drug in 2024.[2]
Reference: See footnote 2
2. Surrogate endpoints standing in for real ones.
Around 37% of major published medication trials use a surrogate primary endpoint: a biomarker or laboratory value that the company argues predicts a real clinical outcome.3 For example: tumour shrinkage instead of survival, or LDL cholesterol instead of myocardial infarction. The surrogacy assumption can be weak, and the correlation frequently breaks down in real-world populations. Pfizer’s torcetrapib raised HDL cholesterol substantially in late-stage trials and increased mortality at the same time. The ILLUMINATE trial was halted in 2006 and the programme abandoned.4 The lesson generalises: a drug that moves the biomarker is not necessarily a drug that helps the patient.
How to check: This one is simple. Ask whether the outcome being reported would matter to you as a patient. A tumour that shrinks on a scan is not the same as living longer; an LDL number that drops is not the same as avoiding a heart attack. FDA briefing documents and EMA European Public Assessment Reports state explicitly when an approval rests on a surrogate.
3. Composite endpoints that dilute the important signal.
Around 34% of major published trials use a composite primary endpoint, bundling a serious event (death, hospitalisation) with a minor one (a clinic visit, a transient symptom) into a single number.5 The drug may drive only the minor component while the headline reads “significant reduction in the composite endpoint.” When you read a composite, ask which component is doing the work. The trial publication usually contains the breakdown. The press release rarely does.
How to check: Look for outcomes bundled together in the headline, then find the component-level breakdown in the published paper’s supplementary materials or the FDA statistical review. If the only component driving the headline result is the least serious one, while the serious components are flat or trending the wrong way, the composite is concealing more than it reveals.
4. Disease-specific mortality versus all-cause mortality.
Among trials where the primary endpoint involves mortality, around 27% use disease-specific rather than all-cause mortality.6 A cancer drug that reduces cancer deaths while increasing cardiovascular deaths looks like a success on disease-specific mortality and like nothing of the sort on all-cause mortality. All-cause mortality is harder to game because it counts everyone who dies, regardless of cause. Where it is available and the trial is not powered for it, that itself is a signal. No one wants a drug that kills the cancer but also kills the patient. All-cause mortality is always the higher-quality check.
How to check: Look for “all-cause mortality” rather than “deaths from disease X”. Be alert to language that explains away on-trial deaths as unrelated to the treatment or to the underlying disease. The trial registration’s posted results section and the FDA statistical review should give the all-cause numbers; if they are absent or buried, ask why.
5. Outcome switching after the results are in.
A primary outcome pre-specified in the protocol becomes a secondary outcome, or the thresholds for what constitutes success are quietly redefined.
How to check: Did they move the goalposts? Compare the published outcomes against the protocol and the trial registration on ClinicalTrials.gov, paying attention to thresholds for “response”, “recovery”, or “success”. Where definitions have shifted between the protocol and the published paper, the trial is reporting a different question from the one it was designed to answer.
Case Study
The PACE trial of cognitive behavioural therapy and graded exercise therapy in ME/CFS is the clearest illustration in any field I have followed closely. The original protocol defined recovery using strict thresholds: a score of 85 or above on the SF-36 physical function scale and a Chalder Fatigue score of 3 or below (bimodal scoring). The published recovery analysis used substantially weaker thresholds — 60 on the SF-36 and 18 or below on the Chalder Fatigue scale (Likert scoring). The SF-36 entry criterion for the trial was 65, meaning a participant could be classified as “recovered” on a score that would not even have qualified them to enter the study. Using the revised thresholds, 13% of participants met the criteria for “recovery” at baseline, before receiving any treatment.[7] The COMPare project at Oxford has documented outcome switching across leading journals at scale, with a majority of trials adding or removing outcomes from those originally pre-specified.[8]
References: See footnotes 7,8,910
Statistical tricks
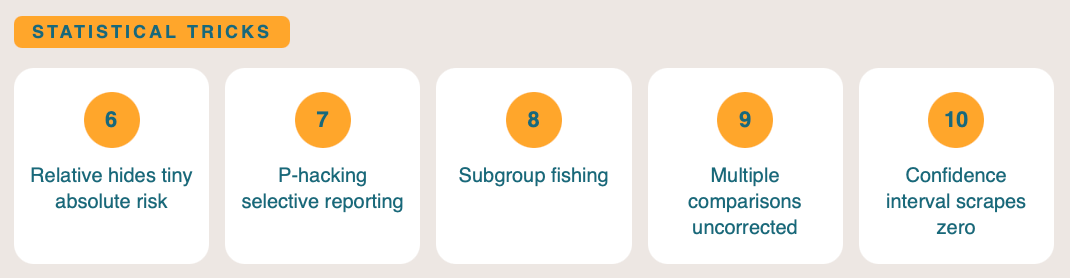
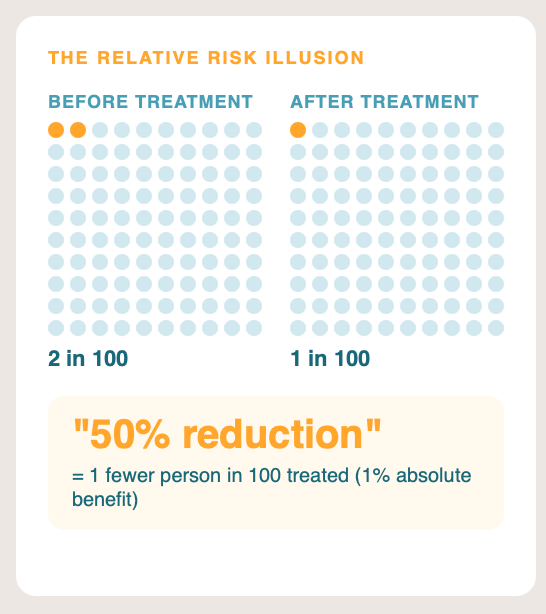
6. Relative risk instead of absolute risk.
A drug that reduces the risk of an event from 2% to 1% produces a “50% relative risk reduction” headline. The absolute risk reduction is one percentage point. Reporting relative risk while omitting absolute risk is one of the most consistently documented forms of misleading reporting in clinical research.1112 Investors and journalists almost never convert back. Always ask for the absolute numbers; if the press release does not give them, find the paper.
How to check: Find the absolute event rates in each arm in the paper or supplementary materials. A “50% reduction” can mean a fall from 2% to 1% (absolute risk reduction one percentage point, number needed to treat 100) or a fall from 80% to 40% (absolute risk reduction forty percentage points, number needed to treat 2.5); the clinical and commercial implications are completely different. The number needed to treat calculators at TheNNT.com convert relative measures to absolute ones quickly.
7. P-hacking.
Running multiple analyses until one clears p < 0.05, then presenting only that one. P-values that cluster just below 0.05 are themselves a statistical signal: genuine effects tend to produce much smaller p-values, and a peak at 0.04 in the literature is suggestive of selective reporting.13 Forms include preferential rounding (reporting 0.053 as “< 0.05”), switching the statistical test after seeing the results, and inappropriate segmentation of the data.
How to check: Look for many borderline-significant results presented in parallel, rather than one strong primary signal. Compare the trial’s pre-registered Statistical Analysis Plan against what was actually reported, and look for p-values clustering just under 0.05 across multiple analyses. Look at effect sizes and confidence intervals, not just whether the p-value crossed an arbitrary threshold.
8. Subgroup analysis fishing.
Beware analyses where researchers test multiple slices of the data until something becomes positive, especially when those subgroups were not pre-specified. A drug that fails in the whole population may appear to “work” in a smaller population with a specific gene for example. Sometimes this is valid but the more subgroups tested, the more chance findings will appear. Pre-specification before the trial, biological plausibility, and replication in an independent dataset are the three things that distinguish a real subgroup effect from a spurious one.
How to check: Confirm the subgroup was pre-specified in the protocol or trial registration before recruitment closed. Subgroups that appear for the first time in conference posters, press releases, or the discussion section of a paper, especially those framed in unusual demographic or biomarker combinations, are post-hoc fishing until proven otherwise. Forest plots in the published paper usually show every subgroup tested, which is the easiest way to count how many bites at the apple were taken.
9. The multiple comparisons problem.
If twenty independent significance tests are run at p < 0.05, one will be positive by chance alone. Multiple tests should use statistical tests designed for multiple testing or use correction (Bonferroni, Holm, Benjamini-Hochberg), the trial’s reported p-values are not what they appear. Correction is rarely applied to secondary or exploratory analyses, and almost never disclosed in press releases.
How to check: Find the Statistical Analysis Plan in the trial protocol or the supplementary materials of the paper. It should state explicitly how multiplicity was handled and which endpoints were considered confirmatory versus exploratory. If a trial reports several positive secondary endpoints without explicit correction described, recalibrate the apparent strength of evidence downward.
10. Confidence intervals that technically exclude the null but barely.
A hazard ratio of 0.94 with a 95% confidence interval of 0.89 to 0.999 is technically statistically significant. It also means the true effect could plausibly be anywhere from a meaningful 11% reduction to essentially zero (0.001% benefit). Press releases often omit the confidence interval entirely and report a “statistically significant benefit.” Width matters; the point estimate alone tells you very little.
In very simple terms, a p value tells you the probability this result was due to chance eg. p = 0.01 means there is a 1 in 100 chance this result is due to chance alone. While a confidence interval shows the range within which the true treatment effect is likely to lie.
How to check: Find the full confidence interval, not just the headline number. The published paper, the FDA statistical review, and the trial registration’s posted results section all carry it. If the upper bound is brushing the line of no effect (1.0 for hazard or odds ratios, 0 for absolute risk differences), the trial has scraped over the line of significance rather than crossed it confidently.
In Part 2 coming soon we will cover Presentation and context tricks and how to read a press release as a sceptic.
I have a chronic illness that limits my capacity to write; AI is sometimes used in drafting text, creating images and checking this work which may introduce errors (from AI or my brain).
Nothing in this newsletter constitutes investment, financial, or medical advice. I am a biotech investor and may hold positions in companies, funds, or sectors discussed here. Where a material conflict of interest exists, I will disclose it in the relevant piece. This writing is primarily my opinion and facts are referenced to allow checking. Opinions are my own and subject to change as evidence develops.
Hypothesis Next explores the intersection of science, health, and the forces that shape social and financial capital. If this added value, please consider donating to the Open Medicine Foundation, the world’s leading nonprofit funding research into ME/CFS and Long Covid. A cause close to my heart. Visit OMF.ngo to donate or learn more.
References
Goldacre B, Drysdale H, Dale A, et al. (2019). COMPare: a prospective cohort study correcting and monitoring 58 misreported trials in real time. Trials 20: 118.
See also Chan AW, Hróbjartsson A, Haahr MT, Gøtzsche PC, Altman DG (2004). Empirical evidence for selective reporting of outcomes in randomized trials. JAMA 291: 2457–2465.
U.S. Food and Drug Administration (2021). Aduhelm accelerated approval letter and statistical review. Biogen press releases, October 2019 and June 2021. Withdrawal announcement: Biogen, January 2024. Independent commentary: Alexander GC, Knopman DS, Emerson SS, et al. (2021). Revisiting FDA approval of aducanumab. JAMA 325(17): 1717–1718.
Yudkin JS, Lipska KJ, Montori VM (2011). The idolatry of the surrogate. BMJ 343: d7995. For empirical fractions across recent major trials, see Yu T, Hsu YJ, Fain KM, Boyd CM, Holbrook JT, Puhan MA (2017). Use of surrogate outcomes in US FDA drug approvals, 2003–2012. BMJ Open 7: e016668.
Barter PJ, Caulfield M, Eriksson M, et al., for the ILLUMINATE Investigators (2007). Effects of torcetrapib in patients at high risk for coronary events. NEJM 357: 2109–2122.
Cordoba G, Schwartz L, Woloshin S, Bae H, Gøtzsche PC (2010). Definition, reporting, and interpretation of composite outcomes in clinical trials: systematic review. BMJ 341: c3920.
For methodological discussion of disease-specific versus all-cause mortality in trials, see Welch HG, Schwartz LM, Woloshin S (2000). Are increasing 5-year survival rates evidence of success against cancer? JAMA 283(22): 2975–2978; and the broader literature on competing risks in trial endpoint selection.
White PD, Goldsmith KA, Johnson AL, et al. (2011). Comparison of adaptive pacing therapy, cognitive behaviour therapy, graded exercise therapy, and specialist medical care for chronic fatigue syndrome (PACE): a randomised trial. Lancet 377: 823–836. Recovery analysis: White PD, Goldsmith K, Johnson AL, Chalder T, Sharpe M (2013). Psychological Medicine 43: 2227–2235.
Critique and reanalysis: Wilshire CE, Kindlon T, Courtney R, et al. (2018). Rethinking the treatment of chronic fatigue syndrome: a reanalysis and evaluation of findings from a recent major trial of graded exercise and CBT. BMC Psychology 6: 6.
Geraghty KJ (2017). ‘PACE-Gate’: when clinical trial evidence meets open data access. Journal of Health Psychology 22(9): 1106–1112.
COMPare project, Centre for Evidence-Based Medicine, University of Oxford. Goldacre B et al. (2019), as above.
Schwartz LM, Woloshin S, Dvorin EL, Welch HG (2006). Ratio measures in leading medical journals: structured review of accessibility of underlying absolute data. BMJ 333: 1248.
Sedrakyan A, Shih C (2007). Improving depiction of benefits and harms: analyses of studies of well-known therapeutics and review of high-impact medical journals. Med Care 45(10 Suppl 2): S23–S30.
Head ML, Holman L, Lanfear R, Kahn AT, Jennions MD (2015). The extent and consequences of p-hacking in science. PLoS Biology 13(3): e1002106.
Great write up, thank you
great work TY